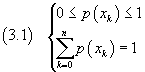
If the sample space is the ordered set of the n discrete real values xk that can can be taken by the real variable x, a real function p(xk) such that
is said a discrete probability distribution and x is said a random or stochastic variable.
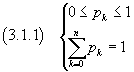
For simplicity's sake, in this section we let
![]()
then
Given a discrete probability distribution, two most important descriptors of its global properties are the mean (or expected value) and the variance.
The mean is given by
![]()
If we write as ξk the deviation of the value xk from the mean,
![]()
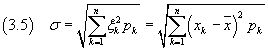
the variance, written as σ2 is the mean of the squares of the deviations:
![]()
The square root of the variance is said standard deviation of the population:
The standard deviation is important because it gives an evaluation of the spread of the values xk around the mean: the bigger σ the bigger is the dispersion.
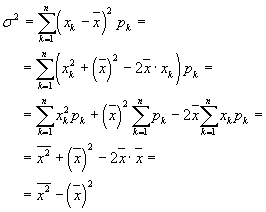
Theorem: The variance is the difference between the mean of the squares and the square of the mean.
![]()
Proof
When the n values pk are all equal the distribution is said uniform.
From the second of the equalities (3.1) we get
![]()
In particular, if xk=k, the mean is
![]()
We have applied the equality
![]()
known from the theory of arithmetic progressions.
From the equality (3.6), the variance is

We have applied the equality
![]()
obtained by induction.
The standard deviation is
![]()
Example
In a roll of a fair dice each of the six outcomes k has probability
![]() .
.
The mean value is
![]()
The variance is
![]()
and the standard deviation
![]()
Given the number of trials n and the probability p, the function pk=Pn,k in the equality (2.9) represents the probability distribution of the random variable k that can take integer values from 0 to n because this function satisfies the conditions (3.1.1). In fact, since p+q=1 by hypothesis,
![]()
Such probability distribution is said binomial distribution or Bernoulli distribution.
From the equality (3.2) the mean value of the binomial random variable k over n trials is
![]()
If we expand the right side we have
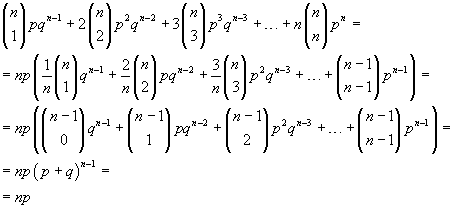
and finally we get
![]()
Moreover we have
![]()
The expansion of the right side gives
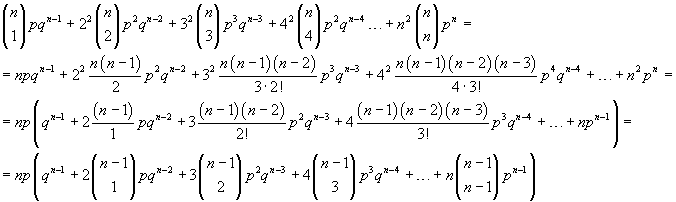
The expression in brackets can be divided into two sums
![]()
![]()
s2 is the mean value of the binomial random variable k over n-1 trials, so from (3.10),
![]()
Then we get
![]()
and finally
![]()
![]()
The following JavaScript application allows you to calculate and to graph a binomial distribution.
The probability p can be expressed either as a decimal or as a fraction.
The values on the ordinate are expressed as a percentage. To view the tables, your browser must allow popups.
If your browser does not allow internal frames, you can directly access the application page.
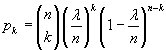
As p approaches 0 and n approaches infinity, the binomial distribution converges to the Poisson distribution.
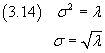
In this case, if λ represents the mean value of the distribution, we have
![]()
The equality (3.14) may be obtained in the following way:
![]()
![]()
From (2.9) we have
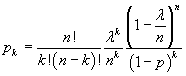
If n→∞ and p→0
![]()
![]()
![]()
then ![]()
If p→0, q→1, then, from the equality (3.12),
The following JS application calculates the probability that an event will occur k times in a Poisson distribution of a fixed mean λ
If your browser does not allow internal frames, you can directly access the application page.
The following JavaScript application allows you to calculate and to graph a Poisson distribution. The values on the ordinate are expressed as a percentage. To view the tables, your browser must allow popups. If your browser does not allow internal frames, you can directly access the application page.